Run Planning Uncertainty Analysis
Replace selected fixed assumptions with defensible probability formulas, simulate the model, and communicate the resulting range.
Summary
This guide adds uncertainty to a reviewed planning model and interprets the result for one decision.
Capabilities
You can replace fixed assumptions with probability formulas, perform Monte Carlo simulations over a standard number of runs, and review percentiles and drivers of variation for any output and planning period. The model supports the use of base and named scenarios for comparison.
Prerequisites
Before You Start
- Use a model with reviewed formulas and actuals.
- Choose one output and period.
- Identify the small number of assumptions whose ranges matter.
- Keep the deterministic base and scenario available for comparison.
- Save a named version before changing established assumptions.
Concepts
Planning uncertainty analysis quantifies the expected range of outputs when model drivers are not known with certainty. By assigning probability functions to major inputs, you simulate possible outcomes rather than relying on single-point estimates. The percentile outputs (like P10, P50, P90) summarize the probability distribution of results, supporting more robust financial and operational decisions.
Workflow
1. State the Question
Write the question in range form.
Examples:
- What range of ending cash does the model produce for December?
- What range of revenue follows from uncertain conversion and pricing?
- What range of payroll follows from uncertain hiring dates?
Choose one primary output. Do not begin by simulating every variable.
2. Select Uncertain Inputs
Choose assumptions that are both uncertain and material.
Good candidates include:
- conversion rate
- customer arrivals
- collection timing
- price realization
- hiring volume
- usage or demand
Do not add a probability function to an imported actual.
3. Choose a Distribution
Use the simplest distribution that reflects the assumption.
- Use
uniform(from, to)for an evenly plausible bounded range. - Use
triangle(from, to)when the middle is more plausible. - Use
normal(mean, variance)for symmetric variation around a mean. - Use
normal_from_interval(from, to, confidence)when you can defend an interval more easily than a variance. - Use
sample(value1, value2, ...)for discrete cases. - Use
poisson(lambda)orbinomial(n, p)for appropriate event counts.
Confirm the function parameters in formula suggestions.
4. Check the Central Value
Save the probability formula and review the ordinary grid.
The grid shows a stable central value when no simulation is running. Confirm that value is reasonable and that the downstream output still calculates.
If the fixed model is wrong, correct it before running uncertainty.
5. Run the Simulation
- Open Model settings, select Scenarios, and find Formula uncertainty.
- Select Run simulation.
- Wait for the 200 model runs to complete.
- Select the output variable.
- Select the decision period.
- Record P10, P50, and P90.
6. Interpret the Range
Compare:
- the deterministic base value
- the selected named scenario
- P10
- P50
- P90
Ask:
- Is the range large enough to change the decision?
- Which assumption creates most of the spread?
- Does the range cross a cash, covenant, margin, or hiring threshold?
- Does the modeled downside remain operationally acceptable?
The percentile range is conditional on the model and distributions. It is not an external forecast guarantee.
7. Challenge the Assumptions
For each probability formula, record:
- the owner
- the source or rationale
- why the distribution shape is appropriate
- why the bounds or parameters are defensible
- the period where the assumption applies
Use row comments when the rationale needs collaborative review.
8. Compare With a Named Scenario
A named scenario is easier to discuss than a percentile alone.
Create or keep a downside scenario that represents a coherent operating case. Compare it with the simulated range.
- If the downside sits near P10, explain why.
- If it lies outside the simulated range, review the distributions.
- If P10 is worse than the named downside, check compounding uncertain drivers.
9. Save the Review Context
- Save a view with the uncertain inputs and selected output.
- Include the relevant periods.
- Add comments that explain the distribution choices.
- Save a named model version.
- Export a point-in-time file when the review needs one.
Record the active scenario and simulation date with the result.
Behavior specification
Troubleshoot
No uncertainty variables appear
Confirm a supported probability function feeds the model and run the simulation again.
The simulation returns an error
Check invalid parameters, upstream formula errors, and the model calculation status.
The result barely changes
Confirm the uncertain input feeds the selected output and increase the range only when business evidence supports it.
The result is implausibly wide
Check variance units, long-tailed functions, duplicated uncertainty, and compounding drivers.
P10 and P90 appear reversed for the business decision
The percentile order is numeric. Interpret whether higher or lower is favorable for the selected variable.
Diagrams
Rendering diagram…
Screenshots
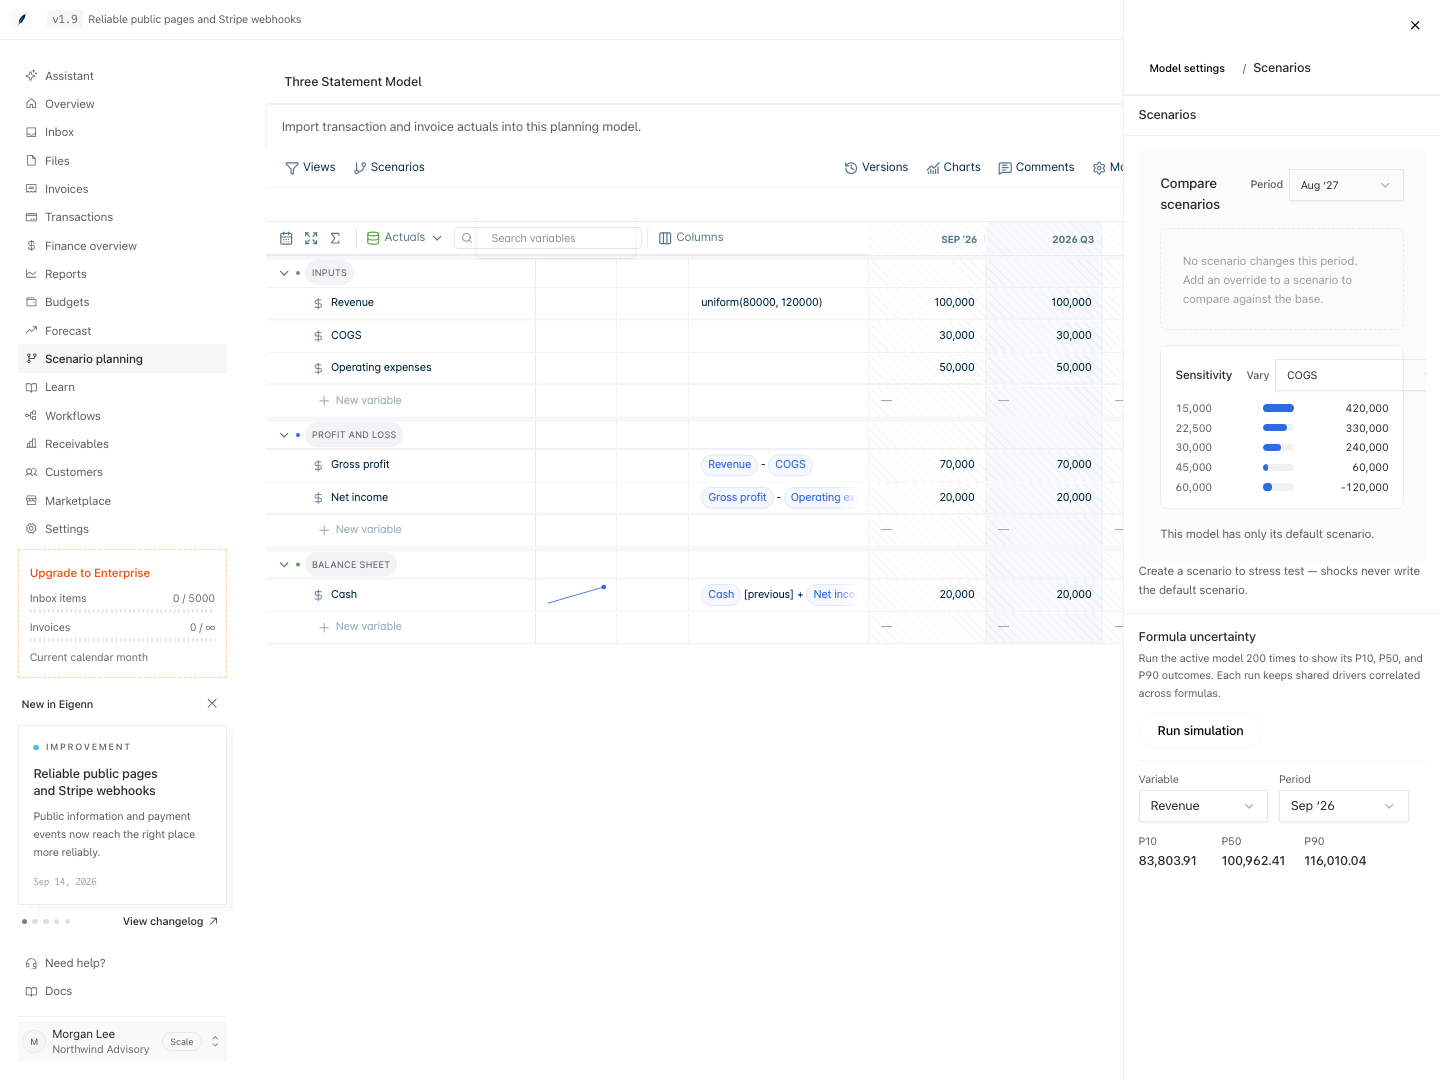
The example uses uniform(80000, 120000) for Revenue. Select a variable and period to review its simulated outcomes.
Verification
- Open the planning model and confirm formulas and actuals are reviewed.
- Save a named version of the model before changes.
- Select a single output and period to analyze.
- Replace one or more fixed input values with probability formulas.
- Confirm the central value in the grid is logical before running uncertainty.
- Run the simulation and wait until all model runs complete.
- Select the output variable and period; note the P10, P50, and P90 results.
- Compare these percentiles to the deterministic base and one named downside scenario; confirm the scenario falls within or near the expected range unless business reasons explain otherwise.
- Record all assigned probability formulas, their owners, sources, and rationale in comments or documentation.
- Save the context (inputs, outputs, periods, comments, model version, export file) for future review and audit.