Values with uncertainty
Write a range or a distribution in a formula, then run a simulation to read the P10, P50, and P90 results.
Some inputs are not one number. Next year's deal size can be anywhere from 8,000 to 12,000. A formula with uncertainty states that range. The grid still shows one number. A simulation then runs the model many times and shows the spread of the results.
Use uncertainty when the size of the range changes a decision. To compare a few named cases, use scenarios instead.
1. Write a range
Write the low value, to, and the high value:
8000 to 12000This is a triangle distribution. Values near the middle are more likely than values near the limits. A range can be part of a larger formula:
Revenue[previous] * (1 + (0.02 to 0.05))The Uncertain input template inserts {low} to {high}.
2. Use a probability function
For a different shape, use a probability function.
| Use | Function | Example |
|---|---|---|
| Every value in the range is equally likely | uniform | uniform(8000, 12000) |
| You know an interval and a confidence | normal_from_interval | normal_from_interval(8000, 12000, 90) |
| Values are positive and can be much larger than usual | lognormal_from_interval | lognormal_from_interval(5, 50) |
| The result is one of a few values | sample | sample(8000, 10000, 12000) |
| The input counts events | poisson | poisson(4) |
The Functions page lists all probability functions. The second parameter of normal is the variance, not the standard deviation.
3. Read the grid value
In the grid, a range or a distribution shows one stable central value. 8000 to 12000 and uniform(8000, 12000) both show 10,000. Every formula that reads the variable uses that central value. The grid value does not change each time you open the model.
4. Run the simulation
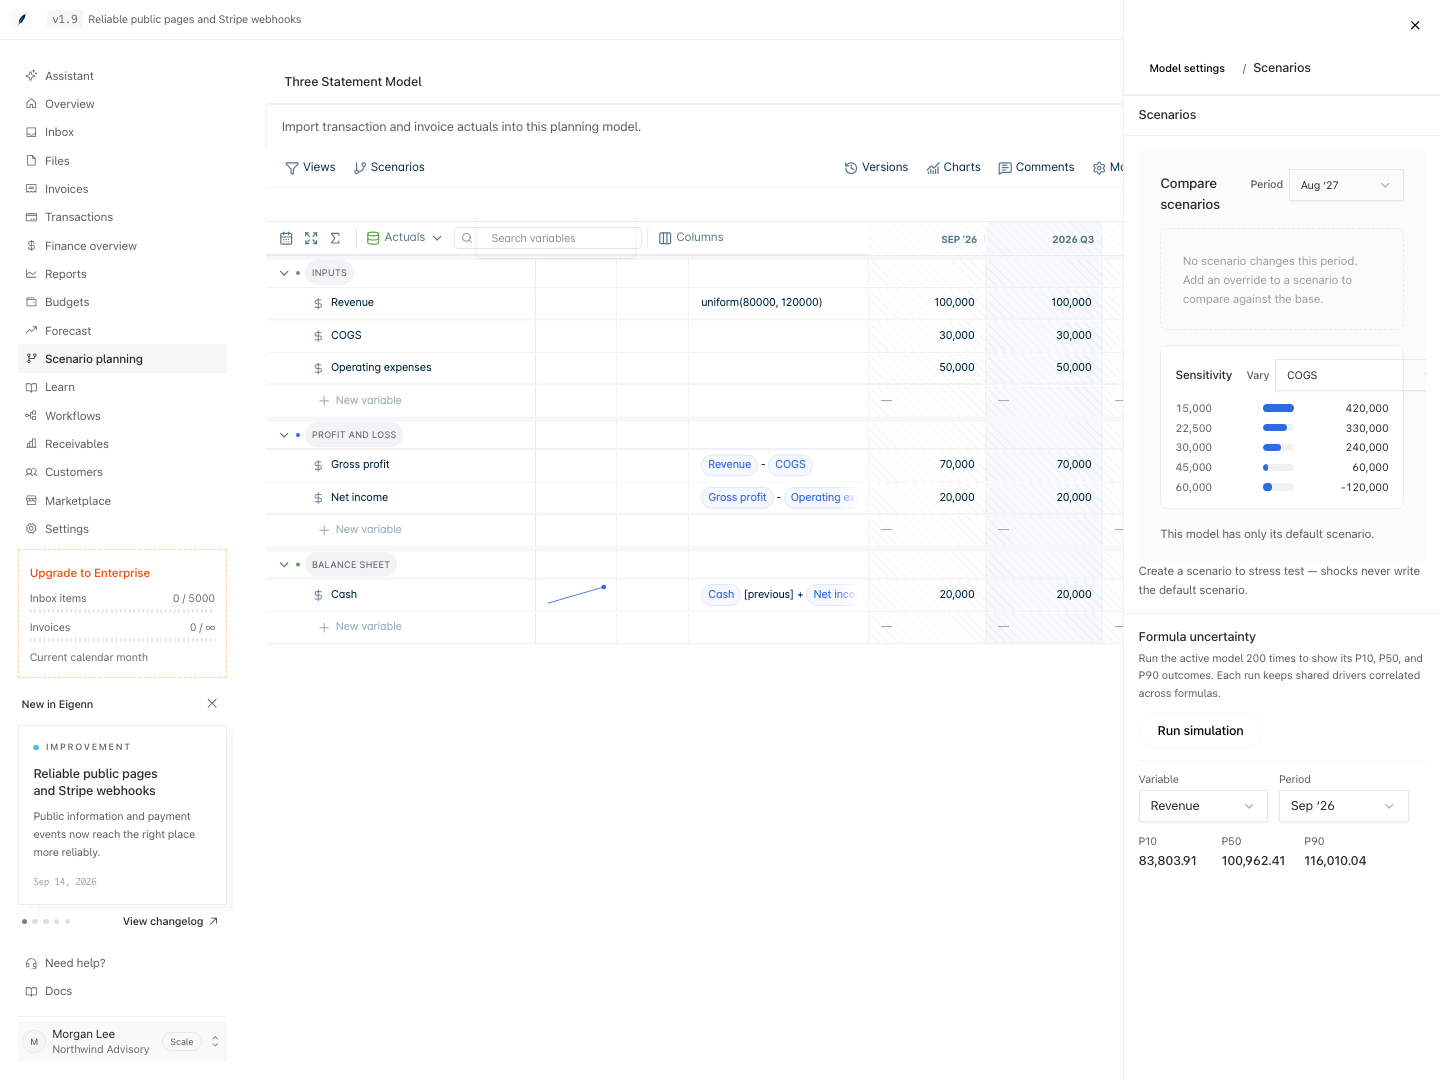
- Go to Scenario planning → open a model.
- Select Model settings.
- Select Scenarios.
- Under Formula uncertainty, select Run simulation. The button shows Simulating… until the run completes.
- In Variable, select the variable that you want to read.
- In Period, select the period. The first forecast period is the default.
- Read the P10, P50, and P90 values.
5. Understand the result
- Eigenn runs the model 200 times.
- In each run, each uncertain input gets one random value. Every formula that reads that input uses the same value in that run.
- P10: 10% of the runs give a lower value.
- P50: the middle result of the runs.
- P90: 90% of the runs give a lower value.
- The Variable list shows only variables that depend on a range or a distribution.
- The simulation uses a fixed random start. The same model gives the same results each time.
P50 can differ from the grid value. A skewed distribution, or a formula that multiplies uncertain inputs, can move the middle result.
When the model changes, the result clears. Select Run simulation again.
6. Messages
| Message | Meaning |
|---|---|
| This model has no ranges or probability formulas to simulate. | No formula uses to or a probability function. |
| The uncertainty simulation could not be completed. Try again. | The run did not complete. Select Run simulation again. |