Data
Actuals come from connected data sources, link to variables, and stop at the Last actual date, where the forecast starts.
In a plain spreadsheet, actuals arrive by copy and paste. Someone exports a report, pastes last month into a column, and types over the forecast. After a few closes, nobody can say which numbers came from the books and which numbers are estimates.
In Eigenn, actuals come from a data source, not from typing. A variable links to one item in that source. The model's Last actual date sets where the actuals stop and the forecast starts. In a linked row, cells up to and including that date show source data and are read-only. Cells after that date run your formulas and inputs.
1. Actuals come from data sources
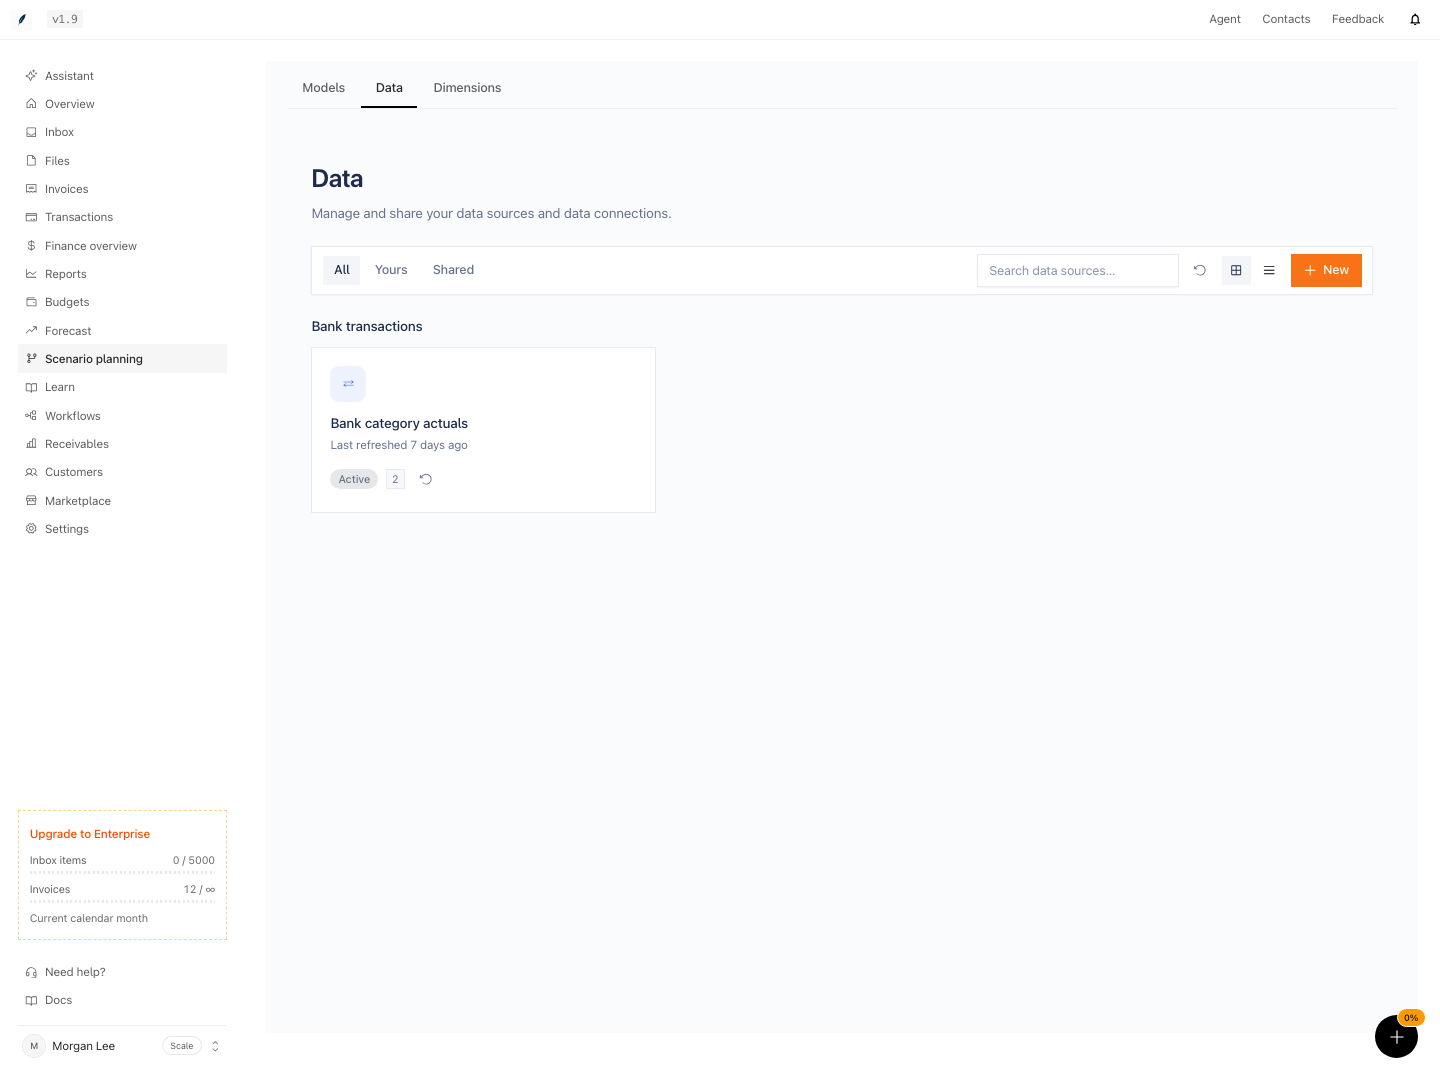
A data source brings one planning dataset into Eigenn. To add one, go to Scenario planning → Data → click New. Choose a source from the catalog. For a statement or transaction source, complete the steps. Then click Create data source.
| Source | Planning dataset |
|---|---|
| Xero | Profit and loss and balance-sheet statements |
| QuickBooks | Invoice actuals from imported QuickBooks invoices |
| Stripe | Invoice actuals from imported Stripe invoices |
| Bank transactions | Monthly rollups for each transaction category |
| CSV import | Transaction-category rollups that include transactions from an imported CSV |
Some sources need a step before you create them:
- Xero needs a Xero connection. Connect it from the marketplace first.
- CSV import needs the CSV on the Transactions page first.
- Invoice actuals need no setup. They appear after Eigenn imports invoices from the provider.
You cannot select the Fortnox card. It shows No planning datasets yet. You also cannot select a card that shows Coming soon.
For statement and transaction sources, set Months of history and Include the current period under Advanced configuration. A refresh reads the source again and replaces its planning records. It does not change your transactions or Xero statements.
2. A variable links to one source item
A data source is not part of a model until you link it to a variable. To link a variable, open the model and click Model settings → Data sources. Each section links a different kind of data:
| Section | Choose | Then click |
|---|---|---|
| Transaction categories | A category source, a category, and a variable | Attach category actuals |
| Actual data (invoices) | A provider, Issued invoice amount or Issued invoice count, and a variable | Attach actuals |
| Statement actuals | A Xero source, a P&L or balance-sheet account, and a variable | Attach statement actuals |
Click Detach to remove a link.
A category that Eigenn excludes from analytics, such as an internal transfer, shows "(excluded from analytics)". You cannot attach it.
Above the grid, click Import actuals to load the team's transaction and invoice actuals into the model. The button shows Refresh actuals when the model has linked transaction or invoice actuals, or a Last actual date.
3. The Last actual date splits each row in two
The Last actual date is a period in the model. That period and every earlier period are actual periods. The next period is the first forecast period.
A linked variable behaves differently on each side of the boundary:
- In an actual period, the cell shows the source value and is read-only.
- In a forecast period, the cell runs the variable's formula. A variable with no formula takes typed input.
Example: Revenue links to Stripe invoice actuals. The Last actual date is Mar '26. The formula is:
Revenue[previous] * 1.03| Period | Jan '26 | Feb '26 | Mar '26 | Apr '26 | May '26 |
|---|---|---|---|---|---|
| Cell | Actual | Actual | Actual | Forecast | Forecast |
| Revenue | 46,000 | 48,000 | 50,000 | 51,500 | 53,045 |
April reads the March actual and adds 3%. When April closes, move the Last actual date to Apr '26. The April cell then shows the source value, and May reads it.
For invoice actuals, an actual period with no invoices shows 0, not a blank.
A model with no Last actual date has no actual periods. A linked source then puts no values in the grid. The linked rows keep their formulas and inputs.
To set the date:
- Click Model settings.
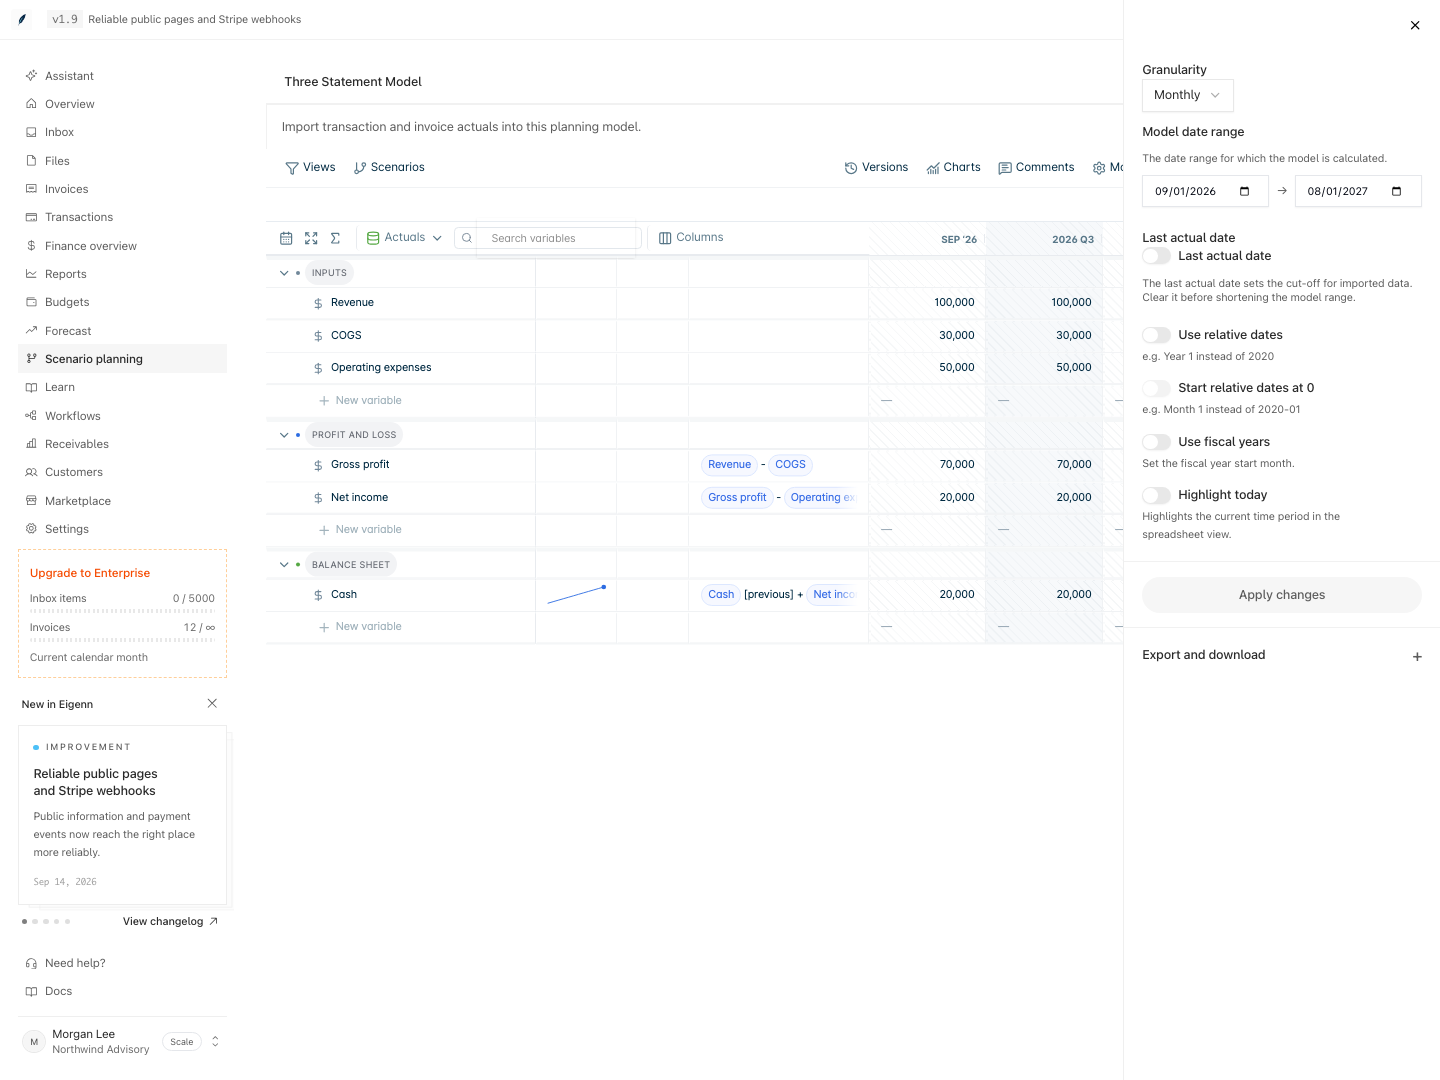
- Turn on Last actual date.
- Choose a period.
- Click Apply changes.
Clear the date before you shorten the model range. The grid header shows the current last actual period. Click it to jump to that period.
4. Scenarios never overwrite actuals
A scenario can change forecast cells only. A scenario edit or a shock skips every actual period.
The boundary can move after you make a scenario change. If a scenario override falls on a period that becomes actual, the actual value wins. Eigenn keeps the override but does not apply it. If you move the Last actual date back, the override applies again.
5. Xero statements use cash or accrual
When you create a Xero source, the wizard asks you to Select an accounting method. Click Accrual or Cash. Accrual is the default.
The cash basis applies to the P&L only. The balance sheet is always on an accrual basis. Transaction-category sources and invoice actuals do not have this setting.