Revenue Forecasting
Predict monthly revenue from its drivers, such as customers, churn, and revenue per account, and test a downside case.
This guide shows you how to predict revenue from the drivers that make it. You start from a revenue template, enter your own drivers, and read the monthly revenue that the model calculates. Then you test a downside case and compare it with your cash forecast. The guide is for founders and finance leads who own the revenue plan.
Time: about 20 minutes
Before you start
- Use an Owner or Member role. A Viewer cannot create or edit planning models.
- Make sure that your workspace has access to Scenario planning.
- Collect your current driver values: customers today, new customers each month, monthly churn rate, and average revenue per account.
- For step 5, make sure that your workspace has Forecast turned on and has connected bank accounts.
1. Choose the template that matches your revenue
Each template below creates a model with monthly periods. Example values fill the input rows. You replace them with your own values.
| Template | Use it when | What it creates |
|---|---|---|
| B2B SaaS Revenue Model | Revenue comes from a base of paying accounts. | A customer base that rolls forward with churn, then MRR and ARR. |
| SaaS Metrics | You already track MRR movement. | Ending MRR, ARR, and Net new MRR, plus Net revenue retention, CAC, and Gross churn rate. |
| Seasonal Revenue | Revenue moves with the calendar. | A baseline that rises in peak months and falls in the other months. |
| Advanced Cohort | Channels have different churn and revenue per customer. | Customers and revenue for each member of the Channel dimension: Organic, Paid, Referral, and Sales. |
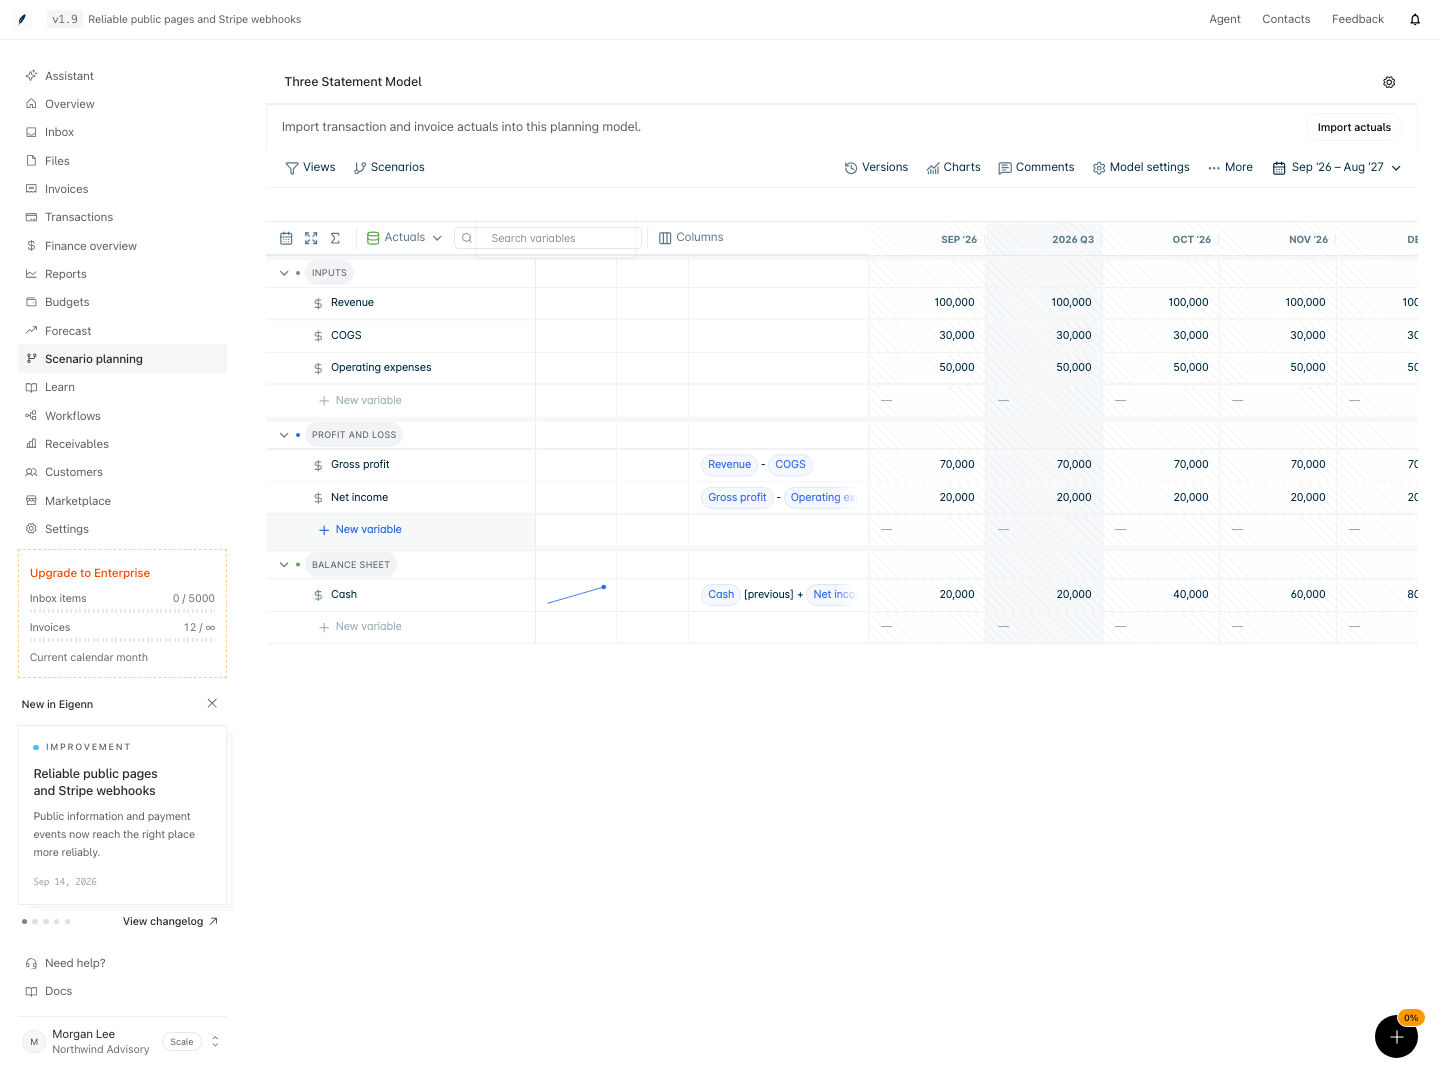
| Three Statement Model | Revenue is one input to a full plan. | A Revenue input that feeds profit and loss and a cash roll-forward. |
This guide uses the B2B SaaS Revenue Model.
2. Create the model
- Go to Scenario planning → click New model.
- In the Create model window, type "revenue" in the search box.
- Select B2B SaaS Revenue Model.
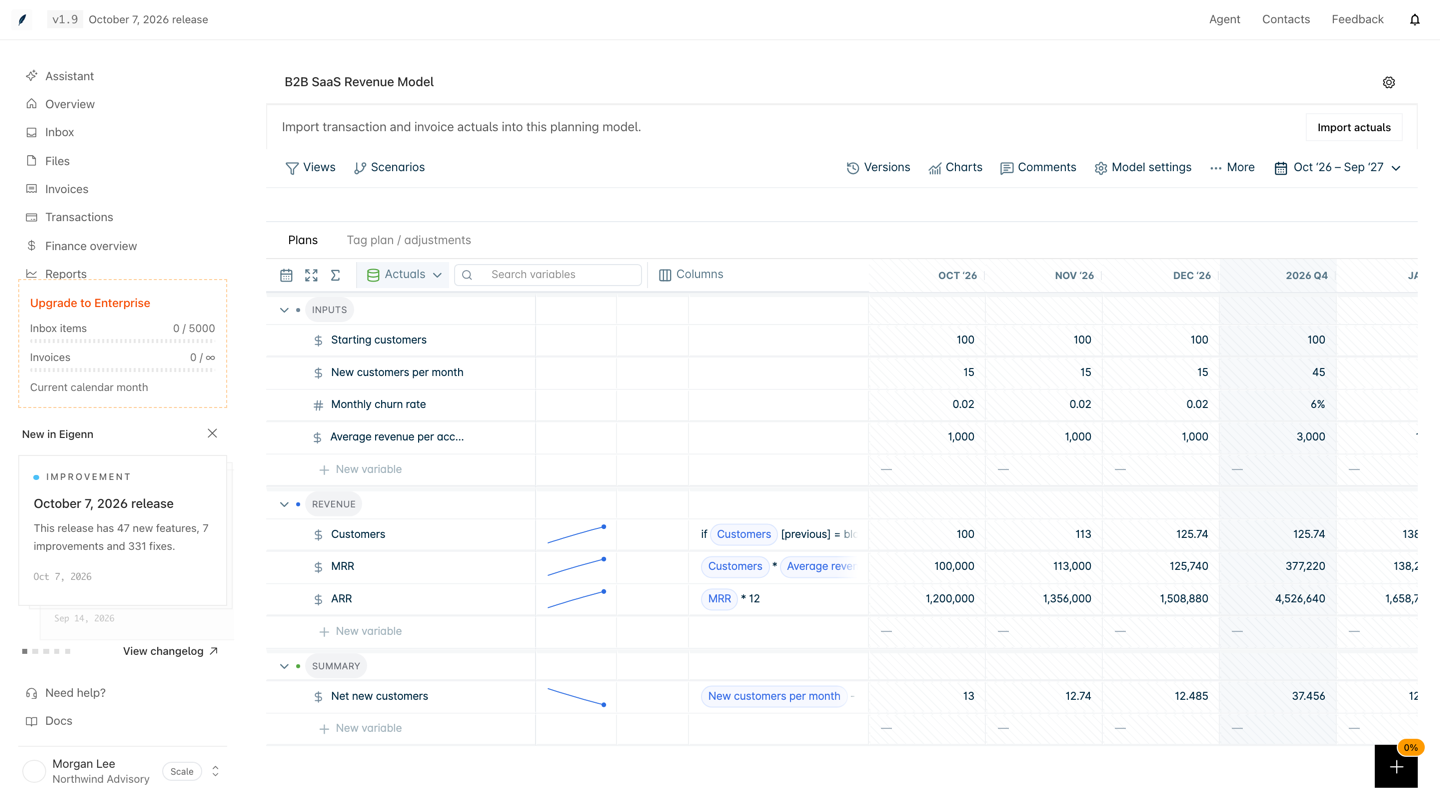
Eigenn creates the model, gives it the template name, and opens it. The model covers 12 months, from the current month. It has three sections:
| Section | Rows |
|---|---|
| Inputs | Starting customers, New customers per month, Monthly churn rate, Average revenue per account |
| Revenue | Customers, MRR, ARR |
| Summary | Net new customers |
The template calculates the output rows with these formulas:
Customers = if Customers[previous] = blank then Starting customers
            else Customers[previous] * (1 - Monthly churn rate) + New customers per month
MRR       = Customers * Average revenue per account
ARR       = MRR * 12
Net new customers = New customers per month - Customers * Monthly churn rate
[previous] reads the value of the preceding period. In the first period, no preceding value exists. Thus Customers starts from Starting customers.
3. Enter your drivers
- Find the Inputs section.
- Replace the example value in each input row with your own value.
- Type the monthly churn rate with a percent sign, for example
3%. Without the percent sign, Eigenn reads3as 300%. - Change the value of one month when a driver changes in that month. For example, enter more new customers after a planned launch.
Check that the chain works. Change New customers per month and confirm that Customers, MRR, and ARR all move.
This example uses the template values: 100 starting customers, 15 new customers per month, 2% monthly churn, and 1,000 average revenue per account.
| Month | Customers | MRR | ARR |
|---|---|---|---|
| 1 | 100 | 100,000 | 1,200,000 |
| 2 | 100 × 0.98 + 15 = 113 | 113,000 | 1,356,000 |
| 3 | 113 × 0.98 + 15 = 125.74 | 125,740 | 1,508,880 |
Add seasonality
When revenue rises in some months, look at the Seasonal Revenue template. It uses these formulas:
Seasonality factor = if month in [11, 12, 1] then Peak factor else Off-peak factor
Seasonal revenue   = Baseline monthly revenue * Seasonality factor
Annual revenue     = sum(Seasonal revenue[all])
month is the calendar month of each period, from 1 to 12. Change the list to your own peak months.
To use the same pattern in your revenue model:
- Use New variable to add Peak factor, Off-peak factor, and Seasonality factor.
- Give Seasonality factor the formula above.
- Add
* Seasonality factorto the end of the MRR formula.
4. Test a downside case
A scenario changes selected inputs. It does not rewrite the base case.
- Click Scenarios.
- Click the plus button in the Scenarios menu.
- Enter a name, such as "Higher churn", in Scenario name.
- Click Save scenario.
- With the new scenario active, change Monthly churn rate in the months that the case covers.
Each changed cell becomes an override of the scenario. The Scenarios menu shows the number of overrides for each scenario. The base scenario shows Default.
To compare the cases, open Scenarios and select Base, and then select your scenario. Compare MRR and ARR in the same months.
5. Compare with the cash forecast
The Forecast page models cash from your workspace data and the assumptions that you set. Use it to see what the revenue plan does to cash.
- Go to Forecast → click 12 months.
- Click Tune forecast.
- Select the Revenue group.
- Set Revenue growth to the monthly growth that your model shows.
- Set Clients cancelling to the churn rate of your downside case.
- Read Revenue impact and the Revenue, expenses, and net chart.
The levers on the Forecast page do not read the rows of your planning model. Enter the values by hand. Then confirm that the direction of the change agrees with your model.
Related
Reconcile and Categorize Transactions
Clear the transaction review queue with categories, receipts, matches, splits, owners, and reporting decisions.
Review a Customer Finance Record
Examine customer-level invoice exposure, payment behavior, communications, and follow-up work before you make a collections or forecast decision.