Headcount Planning
Plan hires and salaries month by month, and see the payroll and overhead costs that follow.
This guide builds a monthly headcount plan in Scenario planning. At the end, you know how many people you employ each month, what they cost, and how the cost changes when you hire. The guide is for founders, finance leads, and department heads who own a hiring budget.
Time: about 15 minutes
Before you start
- Use an Owner or Member role. A Viewer can open models but cannot change them.
- Collect your current headcount, your planned hires by month, and the salaries.
- Know your rate for payroll taxes, benefits, and overheads, as a percentage of salary.
Choose the template that matches the detail you need:
| Template | Use it when | Breakdown |
|---|---|---|
| Headcount plan | One hiring rate and one average salary are enough. | None |
| Headcount by Department | Each team hires and pays at a different level. | Department: Engineering, Sales, Marketing, G&A |
| Advanced Headcount | You plan person by person, with raises and bonuses. | Employee: Alice, Bob, Carol, Dana |
All three templates start with example figures. Replace them with your own.
1. Create the model
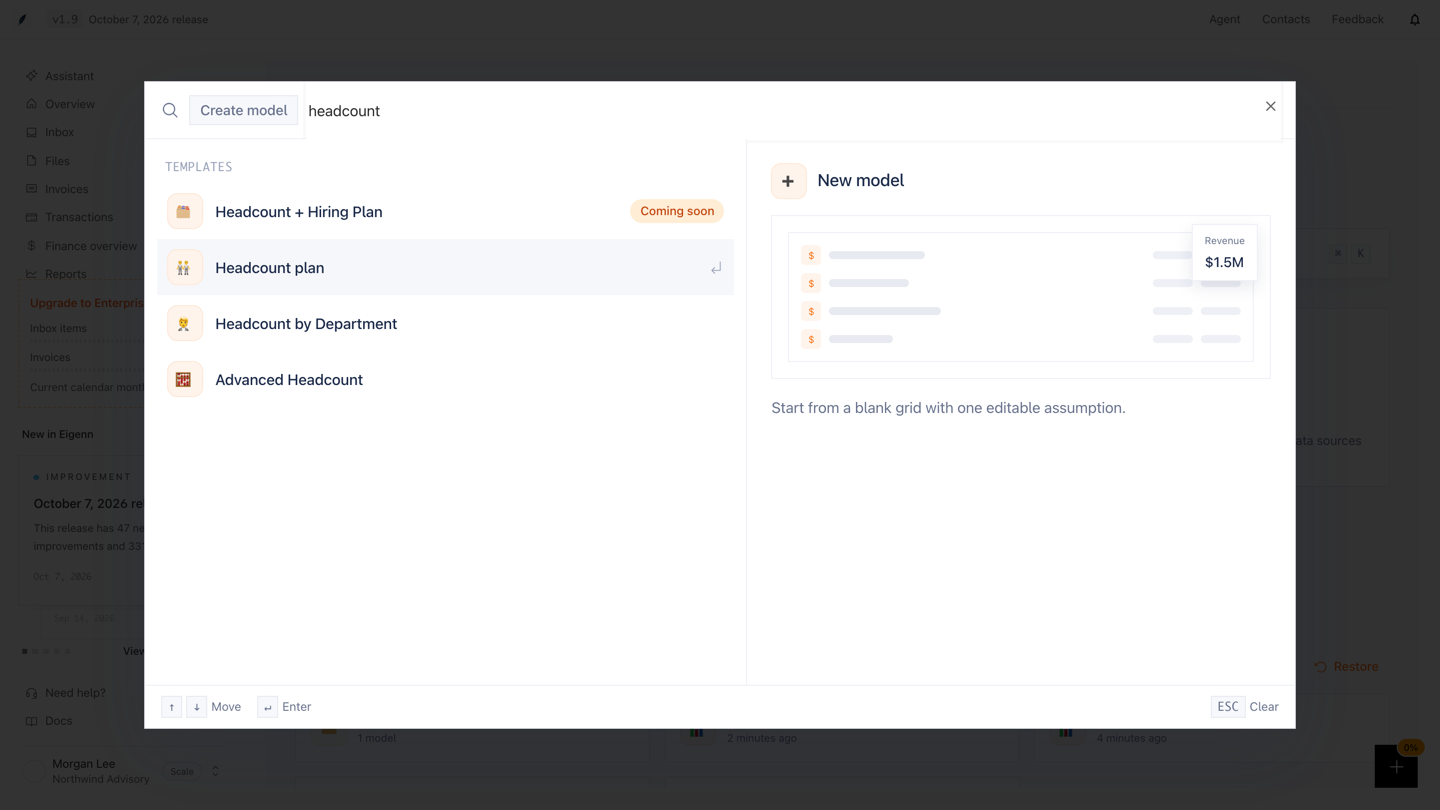
- Go to Scenario planning → click New model. You can also click Quick start.
- In the Create model search box, type
headcount. The Templates group shows the matching templates. - Select a headcount template and press Enter.
Eigenn creates the model, gives it the template name, and opens the grid. The model has 12 monthly periods. The first period is the current month.
2. Read the formulas
Each template puts the assumptions in the Inputs section. The formulas below the inputs calculate the cost. Read them before you change a value.
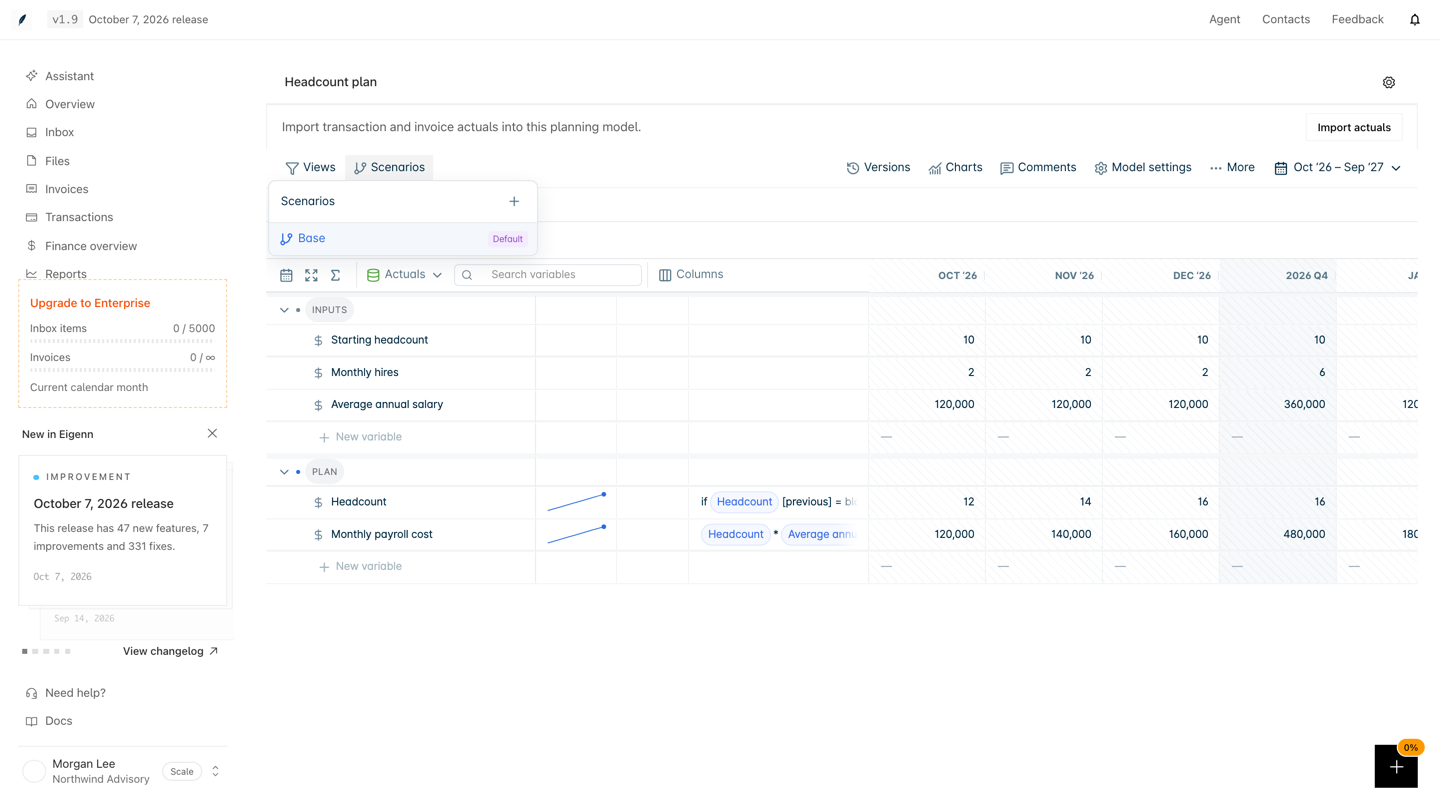
Headcount plan has three inputs: Starting headcount, Monthly hires, and Average annual salary. The Plan section calculates:
| Variable | Formula |
|---|---|
| Headcount | if Headcount[previous] = blank then Starting headcount + Monthly hires else Headcount[previous] + Monthly hires |
| Monthly payroll cost | Headcount * Average annual salary / 12 |
The first period has no previous value, so it starts from Starting headcount. With the example inputs (10 people, 2 hires, 120,000 salary), month 1 has 12 people and costs 120,000. Month 12 has 34 people and costs 340,000.
Headcount by Department has the inputs Headcount, Average annual salary, and Taxes and overheads. The Payroll section calculates Base payroll as Headcount * Average annual salary / 12. Then it calculates Fully-loaded payroll as Base payroll * (1 + Taxes and overheads). Each department calculates its own payroll, and the total row adds the departments. With the example figures and 25% overheads, one month looks like this:
| Department | Headcount | Average annual salary | Fully-loaded payroll |
|---|---|---|---|
| Engineering | 12 | 150,000 | 187,500 |
| Sales | 8 | 120,000 | 100,000 |
| Marketing | 5 | 110,000 | 57,292 |
| G&A | 4 | 130,000 | 54,167 |
| Total | 29 | 127,500 | 398,958 |
The total row of Average annual salary shows the average of the departments, not the sum. Cost per head in the Summary section divides the total Fully-loaded payroll by the total Headcount. In this example, the result is about 13,757.
Advanced Headcount gives each employee an Annual salary and an Annual bonus. Annual raise and Taxes and overheads apply to the whole company. The Payroll and Summary sections calculate:
| Variable | Formula |
|---|---|
| Monthly salary | Annual salary * (1 + Annual raise * timestep / 12) / 12 |
| Fully-loaded cost | (Monthly salary + Annual bonus / 12) * (1 + Taxes and overheads) |
| Annual run rate | Fully-loaded cost * 12 |
timestep counts the periods from 0. The salary goes up a little each month. In month 12, timestep is 11. The monthly salary is then higher than the start value by 11/12 of the annual raise.
3. Enter your own figures
- Click Expand all in the grid header. Each variable with a breakdown shows one row per department or employee.
- Select a cell in an input row.
- Type the value and press Enter.
Each period holds its own value. To plan hires in a given month, enter the number in that month of Monthly hires. Enter 0 in the months without hires. In Headcount by Department, enter the planned headcount of each department for each month.
After you change one input, make sure that Monthly payroll cost, Fully-loaded payroll, or Fully-loaded cost moves in the expected direction.
4. Add a department or an employee
- In the model toolbar, click More → Dimensions.
- Select Department or Employee.
- Under Items, type the name in Add an item.
- Click the + button (Add dimension item).
Each name must be unique in the dimension. Eigenn adds a row for the new item under each variable that uses the dimension. Enter the values for the new item in those rows.
To rename an example item, such as Alice, type the new name in its row. Then click its save (pencil) button.
5. Test a hiring delay
- In the model toolbar, click Scenarios.
- Click the + button (Create scenario).
- Type a Scenario name, such as
Hiring delayed to Q2. - Click Save scenario.
- Open Scenarios and select the new scenario.
- Set Monthly hires to 0 in the months that you delay.
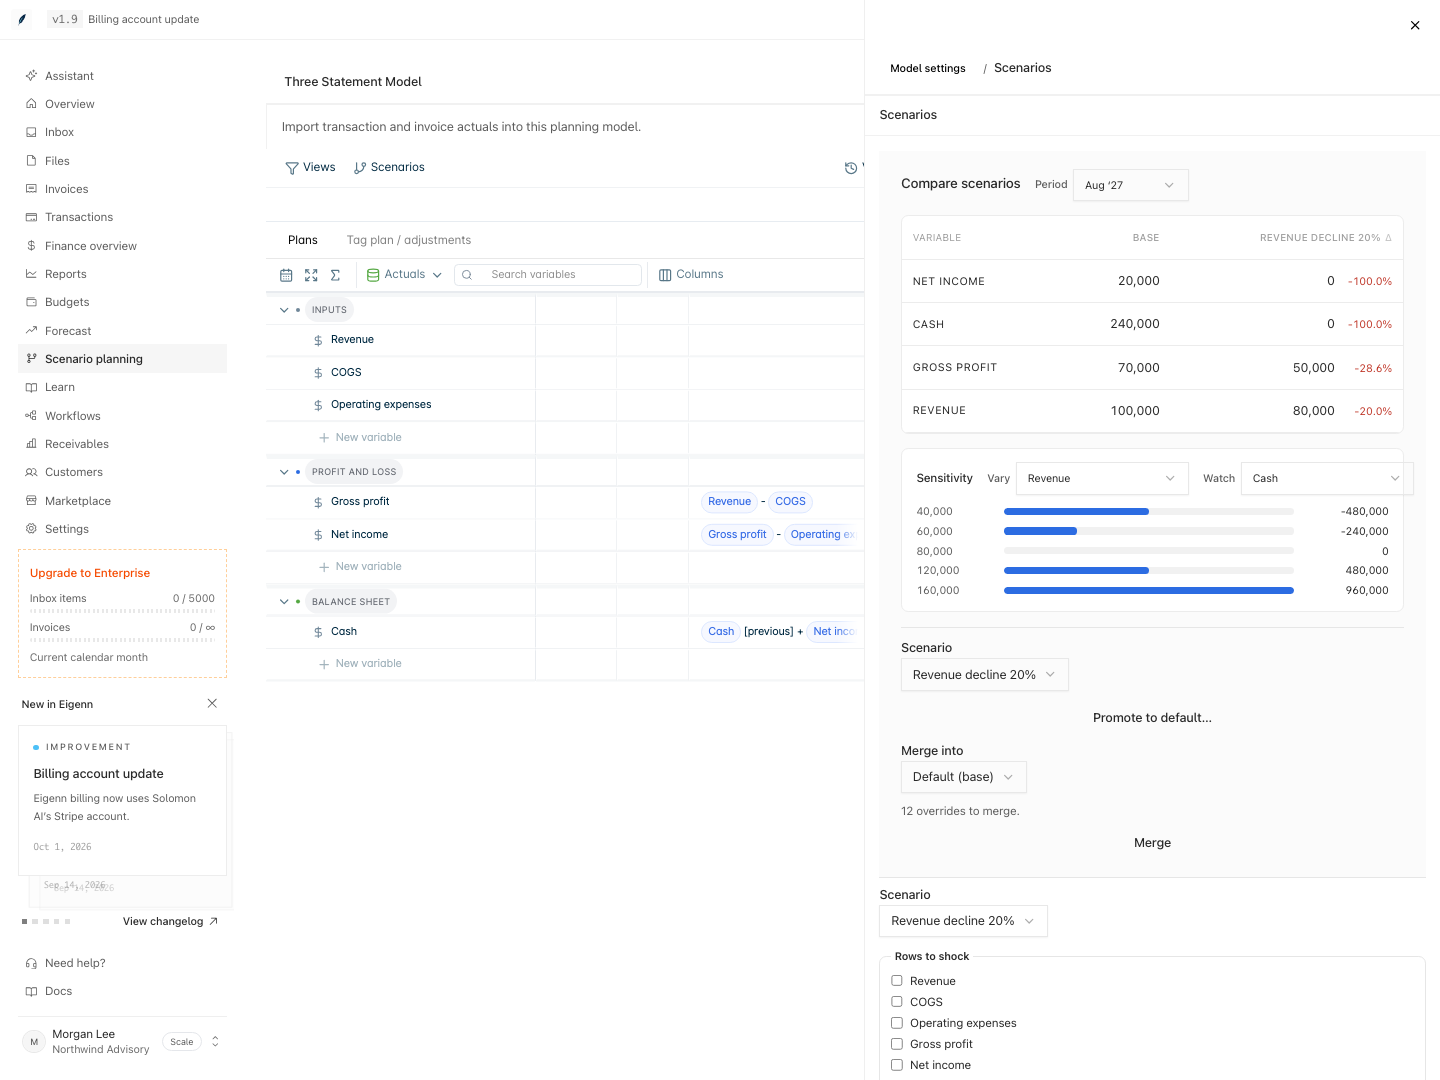
The change applies to the scenario only. The base plan does not change. To compare the two cases, click Model settings → Scenarios. In Compare scenarios, select a Period and read the difference in payroll cost.
6. Use the payroll in another model
A headcount model can supply the payroll cost to an operating plan.
- Open the operating plan model.
- Click More → Linking.
- In Select a model, choose the headcount model.
- Click Add source.
Then reference the payroll variable as Model.Variable in Formula Explorer.
Related
- Dimensions
- Formulas
- Scenarios
- Planning Models and Formulas
- Compare and Share Planning Scenarios
- Stress Tests: the Headcount change lever on the cash forecast
- Consolidation