EIGENN.
docsguidesapichangelogpricingsign in
EIGENN.

Compare scenarios

Read the rows that each scenario changes for one period, test one input with Sensitivity, and see scenario lines in charts.

Compare scenarios shows the same model under each scenario, side by side, for one period. Use it to find which outputs a scenario moves and by how much. The comparison only reads values. It does not change the model.

1. Open the comparison

  1. Go to Scenario planning → open a model.
  2. Select Model settings in the model toolbar.
  3. Select Scenarios.
  4. In Compare scenarios, choose a Period. The default is the last period of the model.

On a narrow screen, scroll the table to the side.
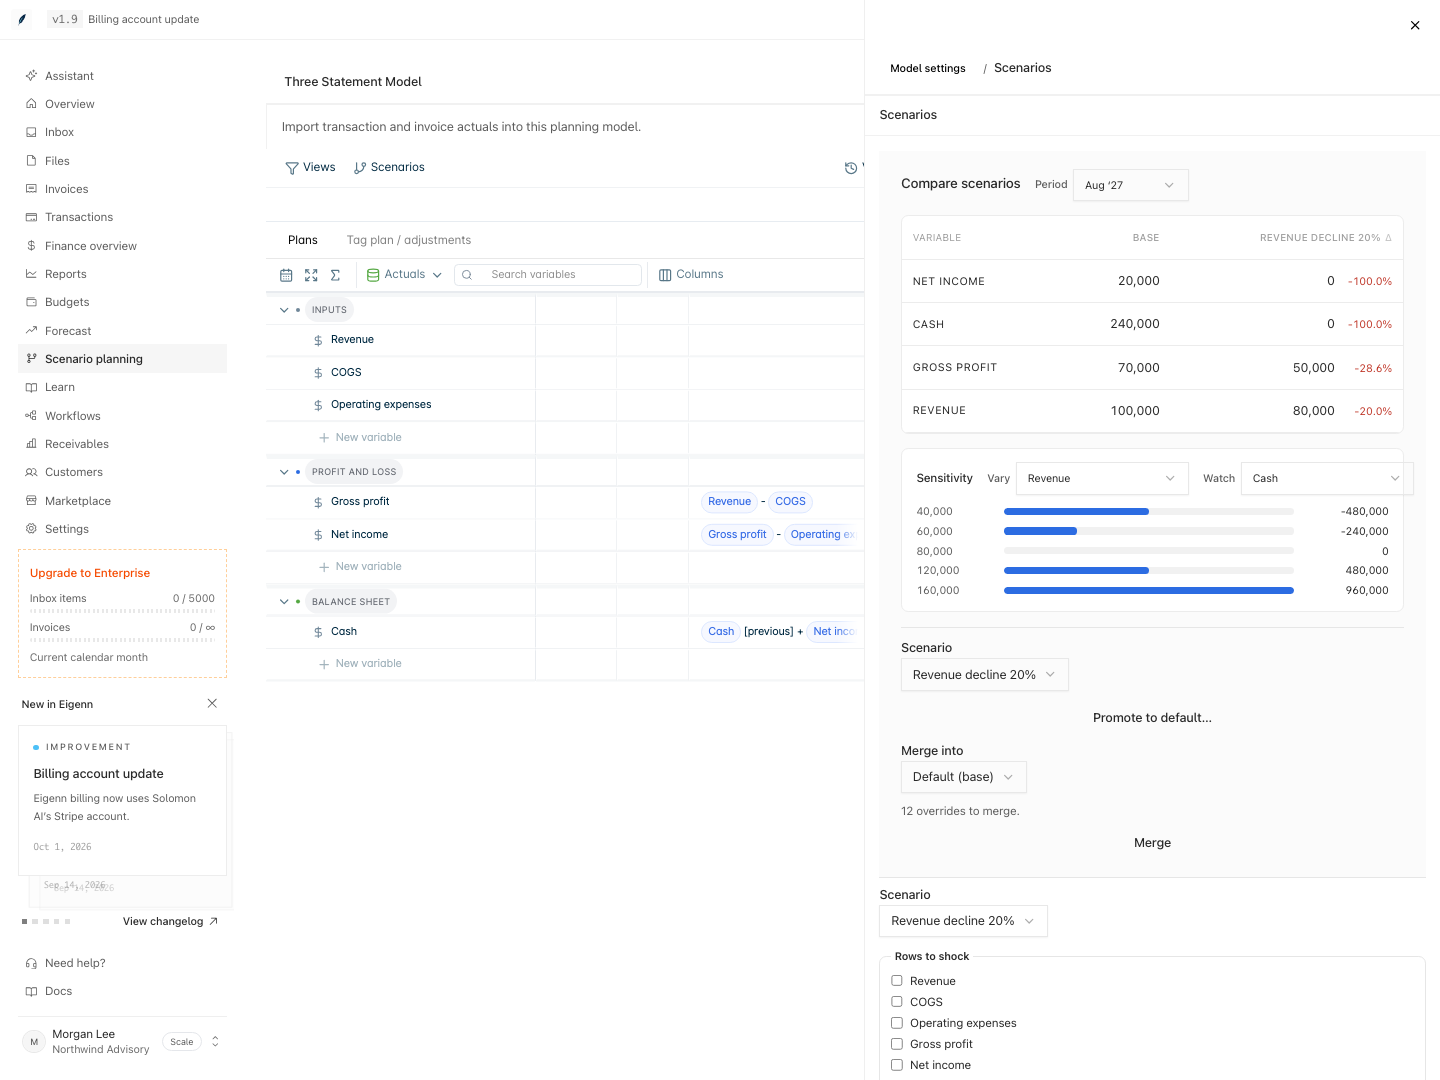
Compare scenarios for Aug '27. Revenue falls from 100,000 in Base to 80,000 in Revenue decline 20%, and Net income falls from 20,000 to 0.

2. Read the table

The table has a Variable column and one column for each scenario. A Δ mark is on each column that is not the base.

RuleWhat you see
Changed rows onlyA row shows only if a scenario changes its value in the selected period.
OrderRows with the largest relative change come first, one scenario at a time.
ChangeEach scenario cell shows its value and the change from the base as a percentage.
Base of zeroWhen the base value is 0, the change shows as an amount.
No changesThe panel shows "No scenario changes this period. Add an override to a scenario to compare against the base."

The table also shows the formula rows that an override moves. For a row where a lower value is better, a decrease shows as an improvement.

3. Test one input with Sensitivity

Sensitivity is below the table.

  1. In Vary, choose a number, currency, or percent input.
  2. In Watch, choose a formula row.
  3. Read the five results.

Eigenn reads the input value in the selected period. It sets the input to 0.5, 0.75, 1, 1.5, and 2 times that value in every forecast period. Then it shows the watched output in the selected period for each value. When the input is 0 or blank, Eigenn starts from 1. Sensitivity does not save an override.

4. See scenarios in charts

Select Charts in the model toolbar.

  • A chart can have comparison series, such as versions. If none of them is a scenario, Eigenn adds a line for each other scenario that overrides a plotted row.
  • A chart shows a maximum of 8 comparison series. The added scenario lines count toward this limit.
  • With two or more scenarios, the Dashboard scenario list changes the scenario for the charts. This choice does not change the model or what other people see.

To set the series of a chart, refer to Compare scenarios and versions in charts.

5. Keep a result

Below Sensitivity, choose a Scenario. Then use one of these actions:

  • Select Promote to default… to see a preview. Select Promote to write the input overrides into the base. Eigenn then removes the scenario. Overrides on formula rows stay out of the base.
  • In Merge into, choose Default (base) or another scenario. Select Merge to copy the overrides. The source scenario stays.

If the target already has an override on the same cell, the target keeps its value. To replace these values, select Overwrite the target's existing overrides before you select Merge.

Eigenn saves a named version before either action. For the full rules, refer to the Scenarios concept.

Related

  • Create a scenario
  • Stress tests and shocks
  • Compare scenarios and versions in charts
  • Compare versions
  • Compare and share planning scenarios

Common formulas: seasonality

Formulas that raise or lower a value in named months, quarters, or by last year's pattern.

Compare scenarios and versions

Switch the scenario of the Charts page, compare a saved version with actuals in a table, and find the side-by-side scenario table.

On this page

1. Open the comparison2. Read the table3. Test one input with Sensitivity4. See scenarios in charts5. Keep a resultRelated

Eigenn docs

current product

Overview
Overview
OverviewAccount PreferencesApproval PoliciesAssistant AutomationAssistant Command CenterAssistant Workspace and Saved WorkBank ConnectionsBilling and UsageBudgets and ForecastCommand CenterCustomer FieldsCustomer LifecycleCustomer RecordsCustomersDeveloper PlatformDocument Processing and ExtractionFiles and Document VaultFinancial Analytics and ReportsFinancial OverviewInbox and ApprovalsInvoice InsightsInvoice ProductsInvoicesMarketplace IntegrationsNotifications and BrandingOnboarding and SupportOverviewPlanning Data and DimensionsPlanning Models and FormulasPlanning Time and ActualsPlanning UncertaintyPlanning Versions and CollaborationPlanning Views and ExportsPlans and AdjustmentsReceivablesReceivables AnalyticsReceivables ControlsRolling Budget CloseScenario PlanningSecurity and AccessSettings OverviewStress TestsTeams and OrganizationsTone Profiles and ExperimentsTransaction Categories and RulesTransaction CodingTransactionsWeekly Finance RitualWorkflow ExecutionsWorkflow OutcomesWorkflow PausesWorkflows
OverviewBudget vs. ActualsBuild a Driver-Based Planning ModelBuild and Review a ForecastBuild Your First WorkflowCollaborate on a Planning ModelCompare and Share Planning ScenariosConfigure Approval PoliciesConfigure Assistant OperationsConfigure Customer FieldsConfigure Notifications and BrandingConfigure Planning Time and ActualsConfigure Receivables ControlsConnect Planning Data and ActualsConnect Transaction RecordsConsolidationCreate and Manage CustomersCreate and Send InvoicesCreate Your First Planning ModelDeveloper API SetupFirst Cash ReviewHeadcount PlanningInvoice Collection WorkflowMaintain Transaction RulesManage Security and BillingManage Team AccessManage the Invoice LifecycleMCP WorkflowsMonitor and Recover WorkflowsOrganize and Share DocumentsProcess Inbox ItemsReconcile and Categorize TransactionsRevenue ForecastingReview a Customer Finance RecordReview, Restore, and Export a Planning ModelRun a Finance Operating ReviewRun a Receivables Tone ExperimentRun a Runway Stress TestRun Planning Uncertainty AnalysisRun Your First Command Center ReviewSave and Share Assistant WorkSet Up a WorkspaceTroubleshoot Account AccessWebhook DeliveryWeekly CFO Review
Overview

Concepts

DataDimensionsFormulasScenarios

Variables

VariablesChange an input over timeCreate a variableFormat a variableOrganize variablesTime totalsUse a variable from another modelVariable types

Time

TimeLast actual dateRoll the model forwardTime granularityTime settings

Formulas

FormulasBlanks and helpersCommon formulas: cash and balance sheetCommon formulas: cohortsCommon formulas: currency and multiple entitiesCommon formulas: headcount and payrollCommon formulas: SaaS metricsCommon formulas: seasonalityConditionalsDimension referencesFormula syntaxFunctionsTime referencesTroubleshoot formulasValues with uncertaintyWrite a formula

Charts and Dashboards

Charts and dashboardsCompare scenarios and versionsCreate a chartExport and shareTablesTime aggregation in charts

Dimensions

DimensionsApply a dimensionCreate a dimensionDimension examplesDimension totalsThe Dimensions page

Data

DataChoose cash or accrual for XeroConnect a data sourceLink a variable to dataRefresh and check actualsUse transaction categories as actuals

Data Integrations

Data integrationsBank transactionsCSV importFortnoxQuickBooksStripeXero

Views

ViewsCreate and edit a viewFilter a viewShare a view

Versions

VersionsCompare versionsRestore a versionSave a version

Scenarios

ScenariosCompare scenariosCreate a scenarioPlans and adjustmentsStress tests and shocks

Collaboration

CollaborationComment on a modelShare a model and set accessTeam roles and planning access

Managing Models

Managing modelsDuplicate a modelExport a modelModel limits and performanceStart from a templateThe models home and foldersTrash, restore, and delete a model
OverviewIntegrationsMCPSDKsWebhooks
OverviewAuthenticationBank Accounts APICustomers APIErrorsForecasts and Stress Tests APIInvoice Payments APIInvoices APIPaginationRate LimitsRemote Tracker API StatusTracker Categories APITracker Entries and Timers APITracker Projects APITransactions APIWebhooks API StatusWorkflows API
Overview
Overview