Compare scenarios
Read the rows that each scenario changes for one period, test one input with Sensitivity, and see scenario lines in charts.
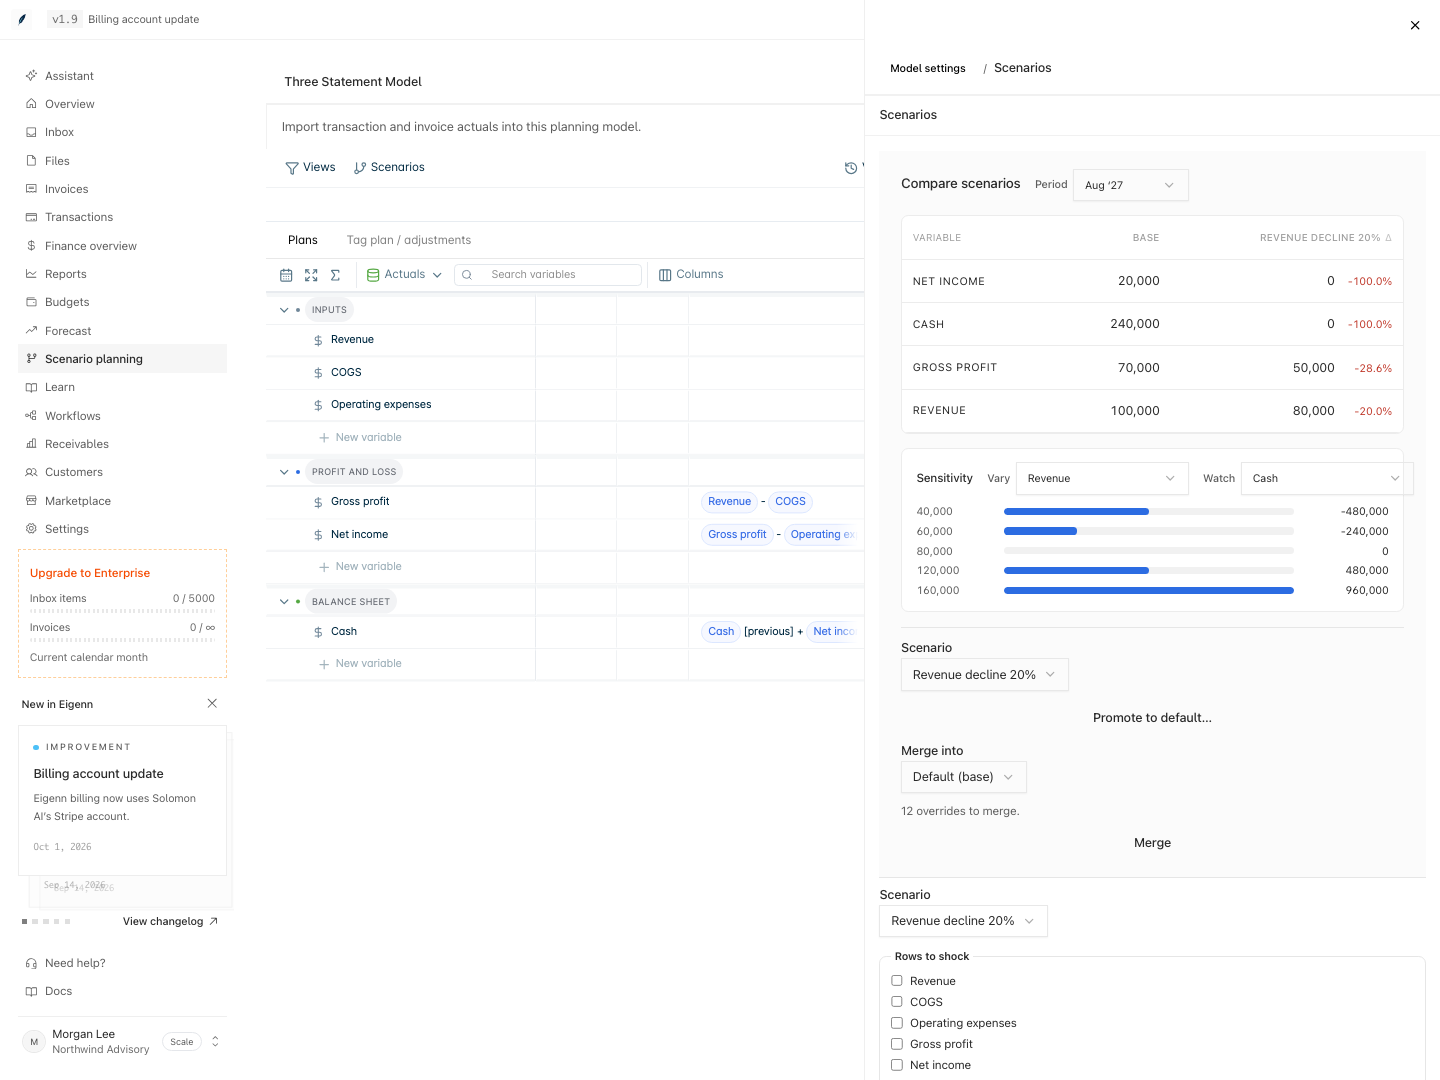
Compare scenarios shows the same model under each scenario, side by side, for one period. Use it to find which outputs a scenario moves and by how much. The comparison only reads values. It does not change the model.
1. Open the comparison
- Go to Scenario planning → open a model.
- Select Model settings in the model toolbar.
- Select Scenarios.
- In Compare scenarios, choose a Period. The default is the last period of the model.
On a narrow screen, scroll the table to the side.
2. Read the table
The table has a Variable column and one column for each scenario. A Δ mark is on each column that is not the base.
| Rule | What you see |
|---|---|
| Changed rows only | A row shows only if a scenario changes its value in the selected period. |
| Order | Rows with the largest relative change come first, one scenario at a time. |
| Change | Each scenario cell shows its value and the change from the base as a percentage. |
| Base of zero | When the base value is 0, the change shows as an amount. |
| No changes | The panel shows "No scenario changes this period. Add an override to a scenario to compare against the base." |
The table also shows the formula rows that an override moves. For a row where a lower value is better, a decrease shows as an improvement.
3. Test one input with Sensitivity
Sensitivity is below the table.
- In Vary, choose a number, currency, or percent input.
- In Watch, choose a formula row.
- Read the five results.
Eigenn reads the input value in the selected period. It sets the input to 0.5, 0.75, 1, 1.5, and 2 times that value in every forecast period. Then it shows the watched output in the selected period for each value. When the input is 0 or blank, Eigenn starts from 1. Sensitivity does not save an override.
4. See scenarios in charts
Select Charts in the model toolbar.
- A chart can have comparison series, such as versions. If none of them is a scenario, Eigenn adds a line for each other scenario that overrides a plotted row.
- A chart shows a maximum of 8 comparison series. The added scenario lines count toward this limit.
- With two or more scenarios, the Dashboard scenario list changes the scenario for the charts. This choice does not change the model or what other people see.
To set the series of a chart, refer to Compare scenarios and versions in charts.
5. Keep a result
Below Sensitivity, choose a Scenario. Then use one of these actions:
- Select Promote to default… to see a preview. Select Promote to write the input overrides into the base. Eigenn then removes the scenario. Overrides on formula rows stay out of the base.
- In Merge into, choose Default (base) or another scenario. Select Merge to copy the overrides. The source scenario stays.
If the target already has an override on the same cell, the target keeps its value. To replace these values, select Overwrite the target's existing overrides before you select Merge.
Eigenn saves a named version before either action. For the full rules, refer to the Scenarios concept.